
Book 12: Getting to Know your Code
| Previous | Next |
Debugging a program
Xcode also comes with a debugger that lets you watch your program execute, live. To use it, simply, open your main.c source file and click in the “gutter” to the left of the first command of your main() function. In the case of our simple calculator program from chapter 4, that would be the vFinished = false; line. A blue “pointing thing” will show up. This is what’s called a “breakpoint”, or “debug checkpoint” and will cause the debugger to stop before executing that line. To remove a breakpoint, simply drag it out the left of the window. Now choose Run from the Product menu.
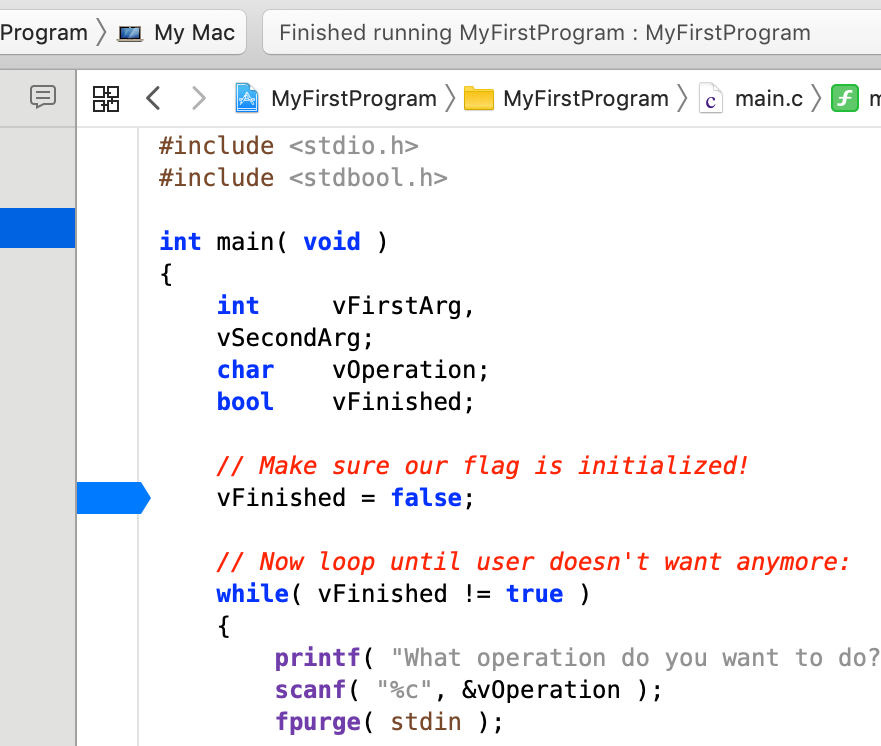
Your application will launch, and then stop at the breakpoint, opening your main.c file with the left column switched to the Debug Navigator. It will mark the current line with a green highlight and a green arrow to its left. You can now point at any variable with your mouse to get a tool tip with its value, and even follow pointers and look into arrays by hovering the mouse over the little triangles next to them.
If the debugger doesn’t stop at your breakpoint, make sure you haven’t turned off breakpoints by accident using the Breakpoints button button at the bottom of Xcode’s window/at the top of the debugger area:

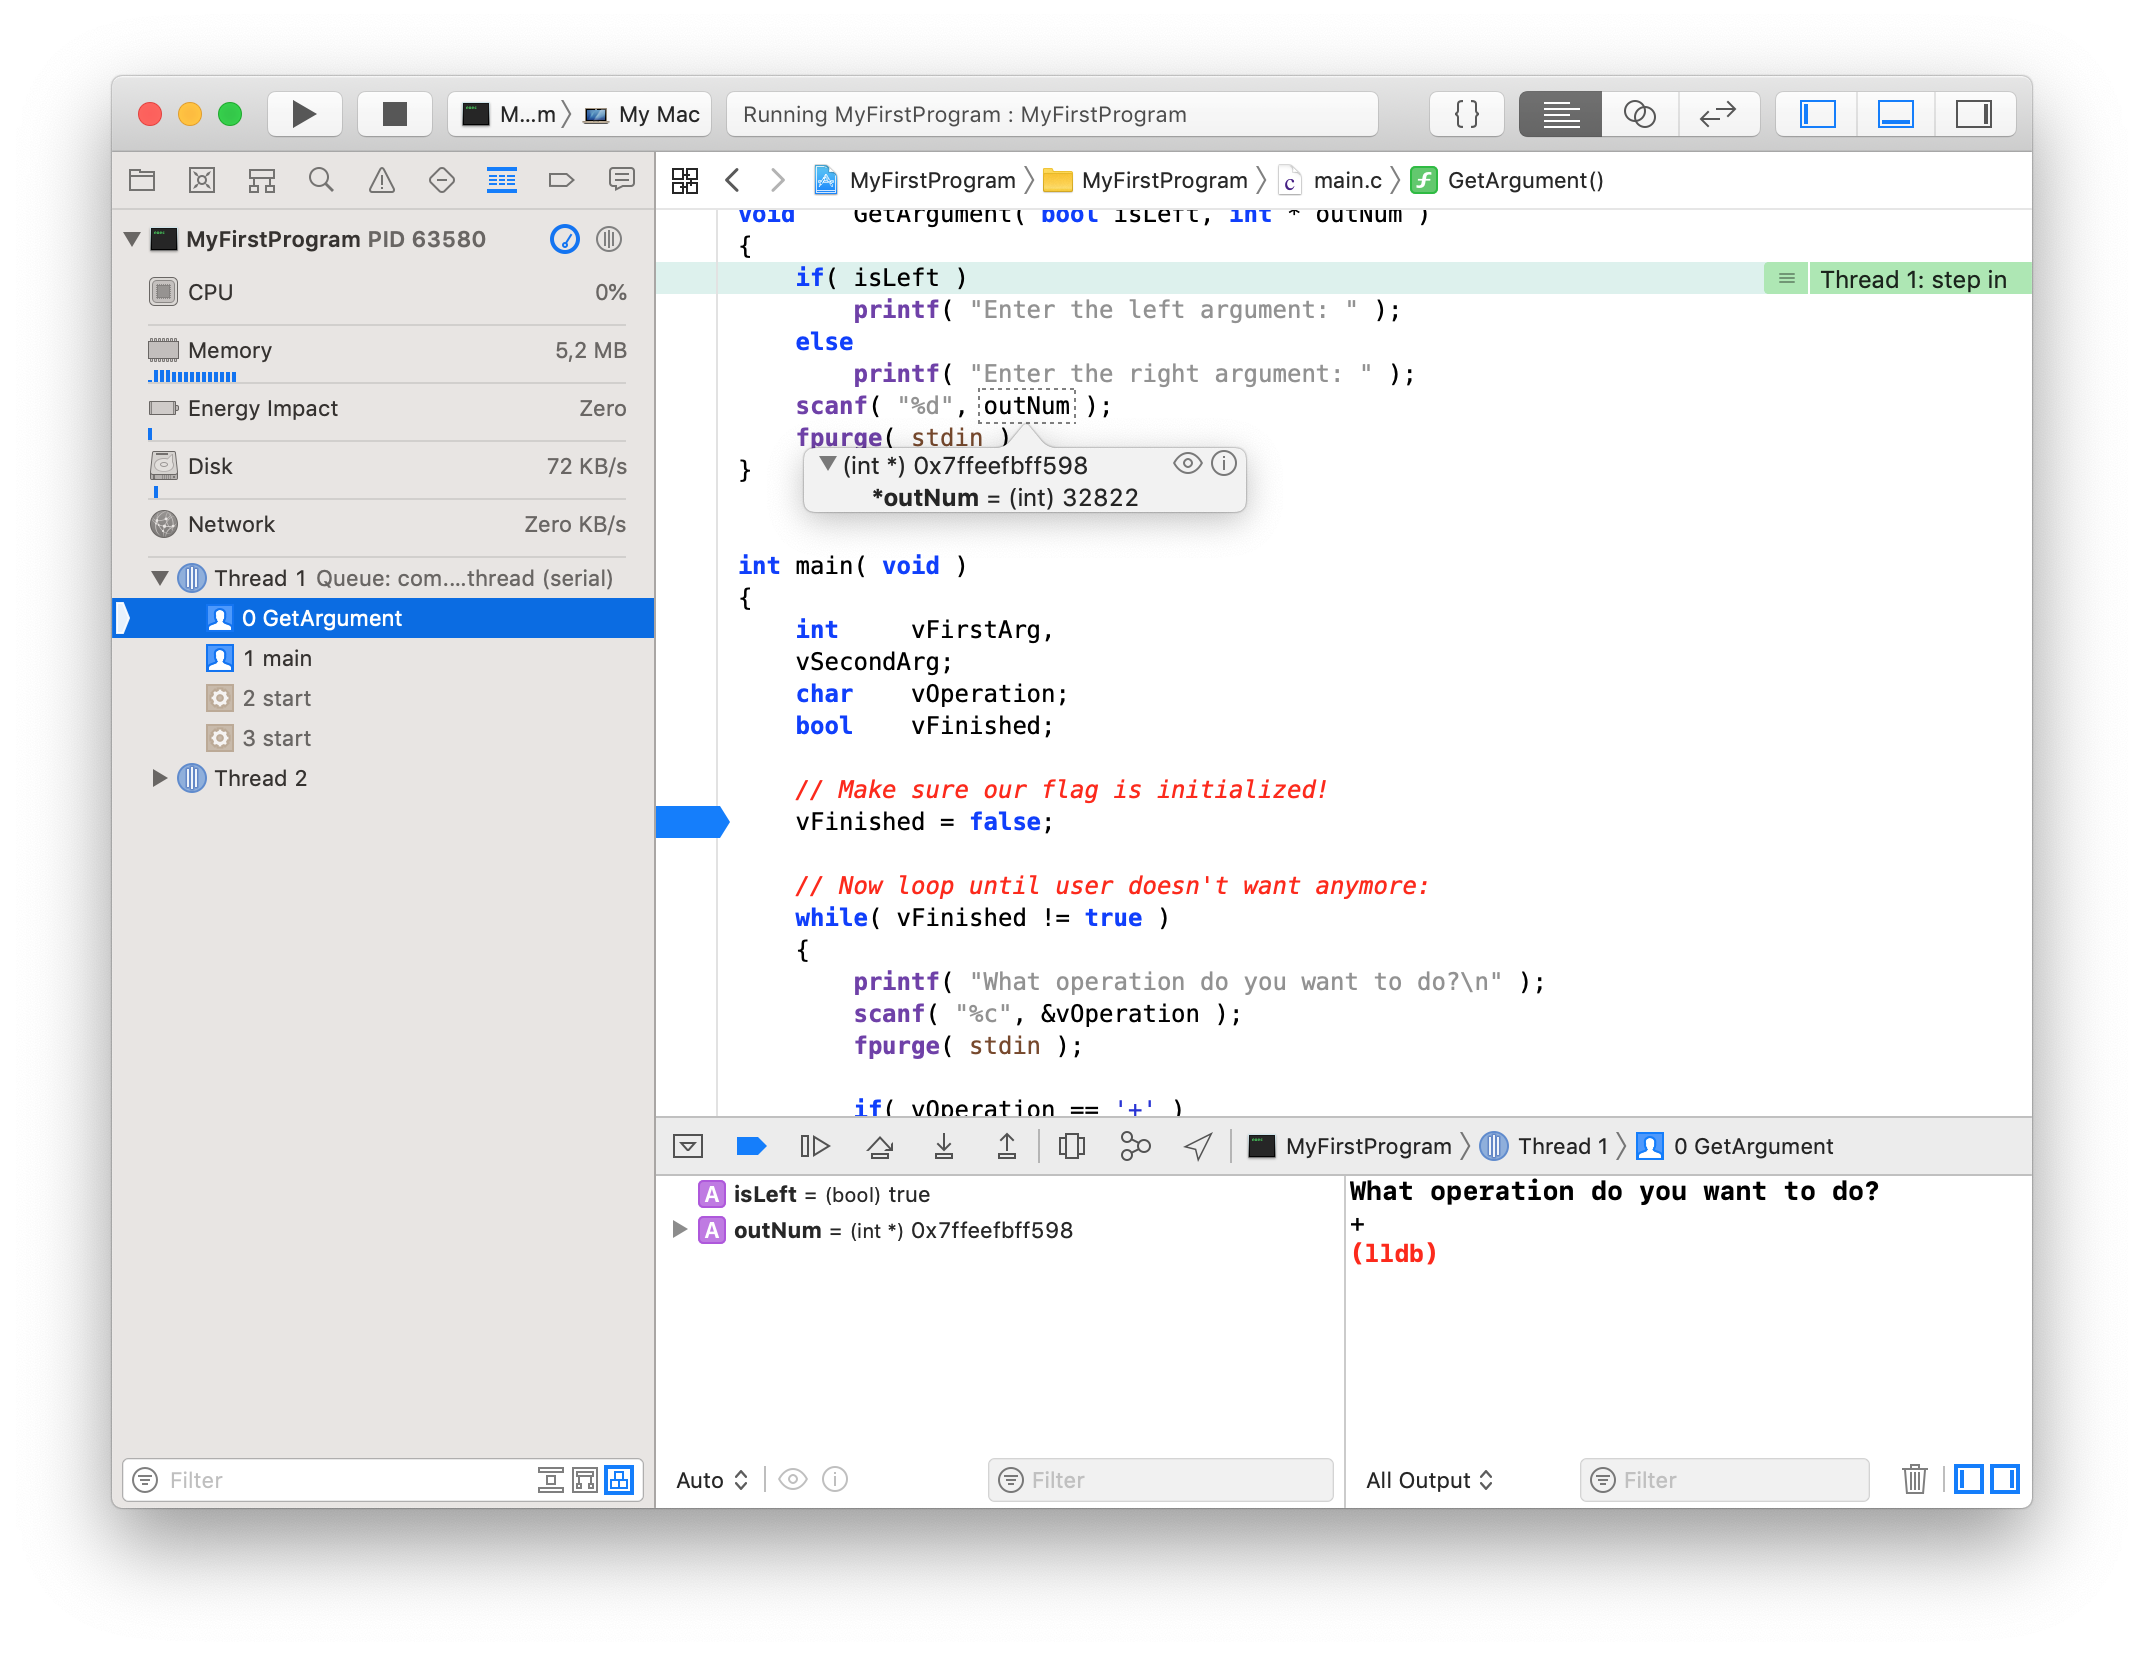
The Debug Navigator in the left (in this screen shot saying GetArgument, main and start) shows you what function called this function, and which one called that, and so on. In this example, the debugger is stopped in the GetArgument() function called by the main() function, and I just used that list to select the main() function and look at the variables at the time it called GetArgument() in the Debug Area at the bottom of the window:
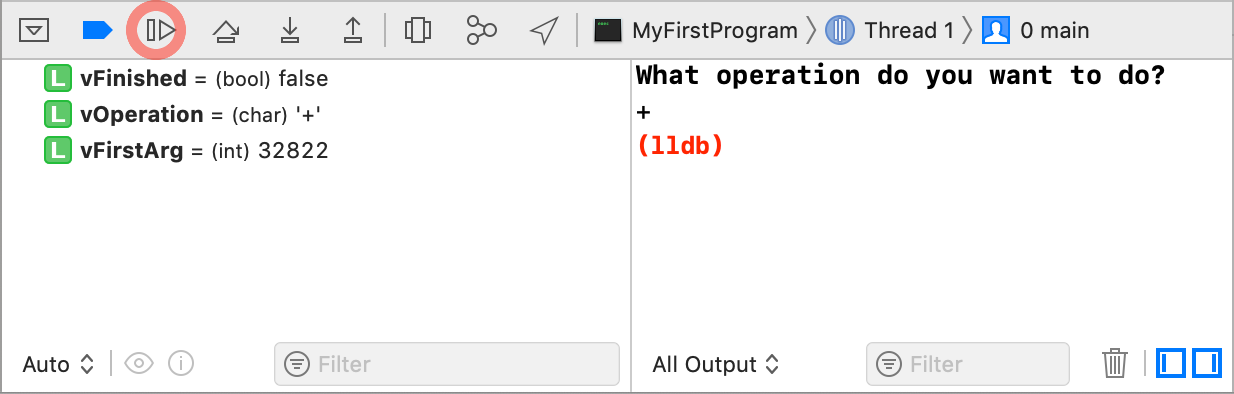
If you were to click the little “Continue Execution” icon at the top of the debug area now (it’s marked with a red circle in the screenshot above), your program would just keep running, finish and quit. But if you want to follow your program along as it runs, you can use the “Step Over” (arrow jumping over a box) and “Step Into” buttons (arrow pointing down at a box) to step through your program, line-wise, where “Step Into” will go into any functions you call and let you step through them line-wise, too, while “Step Over” will see a function call as just one command.
Of course you can still use the three little icons to show/hide the console while you are debugging, but be aware that, while the program is paused in the debugger, the console behaves specially, in that it lets you talk directly to the Debugger (aka lldb) that Xcode uses under the hood (just like it uses llvm). But you’ll probably not need to talk to lldb directly anytime soon, so you can safely ignore that, as long as you remember to click “Continue” before you start typing something into the console.
I encourage you to have some fun now: Take the project for one of our more complex sample programs, set a breakpoint in its main() function at the first line, and step through it. There’s no better way to get a feeling for how your computer works than actually watching it do something. Also, don’t forget to follow some pointers using the little triangles in the Code Sense tool tip for a variable. Addresses are usually not shown in decimal, but in hexadecimal, and prefixed with 0x. You can use Apple’s Calculator application in Programmer mode to convert between decimal and hexadecimal.
Navigating around your Code Efficiently
Whenever you have source code open in Xcode, you can click any word with the command key held down to get a popup with additional options. The most useful here is “Jump to Definition”. I.e. if you’re calling a function and want to know what it does, or what its parameters were again, choose that and it will show you the code you wrote for this function, even if it is in another file.
This also works for system commands (but there it will only show you the declaration), and often their headers contain useful comments. If you choose “Jump to Definition” on something that’s already a definition, you will be brought to its declaration instead, which is handy when you need to keep declaration and definition in sync after changing one of them.
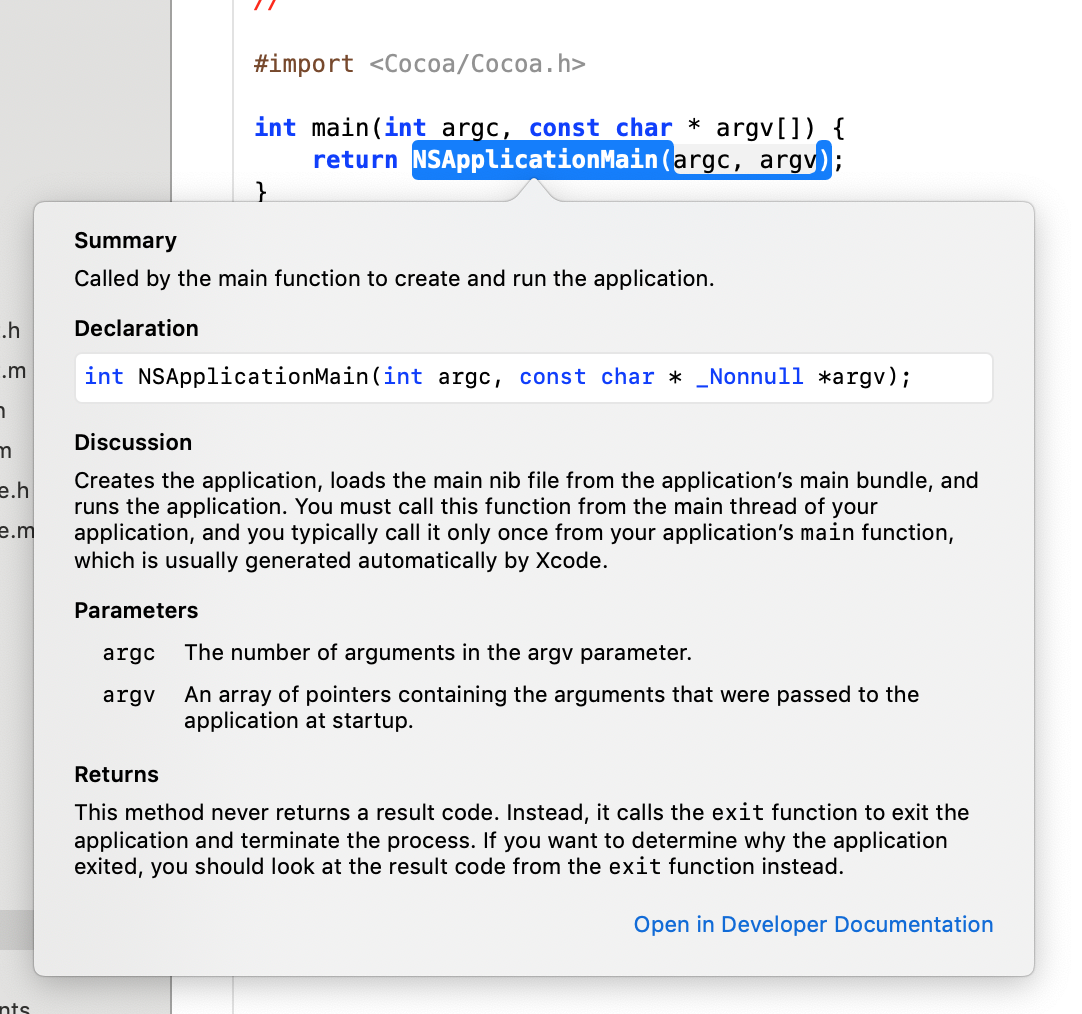
If you choose “Show Quick Help” instead, Xcode will open a small documentation popup reminding you of what this command, function or constant is for. Click the link “Open in Developer Documentation” at the bottom of that window to bring up more information in the Documentation Organizer (available from the Help menu under Developer Documentation).
After navigating through code like this for a while, you will probably find yourself looking at Apple’s headers a lot, and you’ll likely even remember what commands were in what header. In that case, you can use the “Open Quickly” menu item to quickly jump to a particular header or function by just typing part of its name, like a more directed version of Spotlight.
Another nice feature is the search field in the lower left of the project window, which lets you search for a particular file in the Project Navigator (or also in whatever Navigator you currently have showing at the left of your window). This is handy especially for huge, collaborative projects where you may not remember the exact file name.
What else Xcode can do for You
Xcode also has contextual menus with nice features. For example, you can hide the types of variables in the Debug Area’s variable list, click in the text and show where the current file is in the Project Navigator’s list of files, or show a file in the Finder that you have in your project. You can also tell Xcode to split its window into the main text editor and a second Assistant Editor (just option-click on the second file), and even set that editor up so it shows the header file that goes with the source file you’re currently editing, or even split the editor into more than two editors.
And finally, Xcode has a “Preferences…” menu item where you can choose some more tasteful colours for syntax coloring (if you ask me, comments should stand out, so make them red!), and activate lots of other nice features.
| Previous | Next |